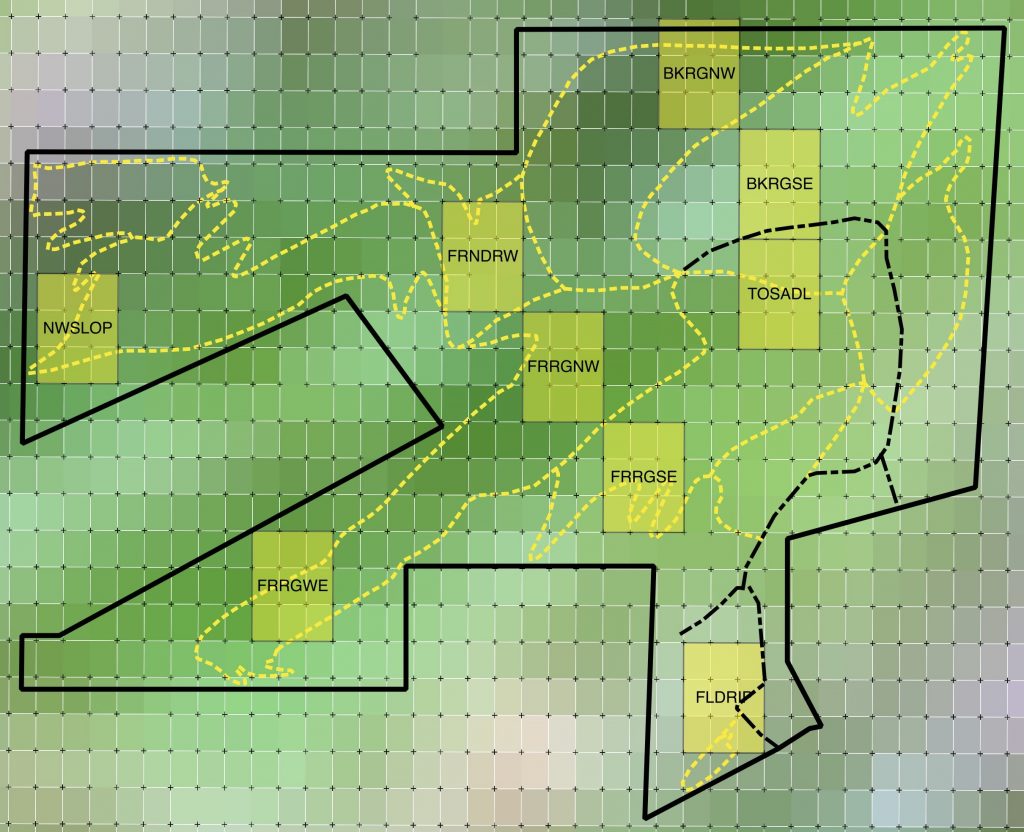
The ACCF site includes nine Landsat plots, providing students a variety of vegetation zones to explore and collect comparative data, and to connect the 78-acre ACCF site with larger scales, up to the entire Earth—all part of ACCF’s Story of Your Place curriculum.

Landsat satellites orbit the Earth collecting data, including earth imagery available in nominal* 30 x 30 meter pixels. The GLOBE field science program includes data protocol based on relatively homogeneous 90 x 90 meter plots—essentially, three pixels wide by three pixels tall.
ACCF has gone one important extra step by actually locating Landsat pixels on its site, via a high-resolution GPS unit. So, our nominal* 90 x 90 meter Landsat plots each include three actual Landsat pixels wide by three pixels tall. As you walk around the ACCF site, you may see metal fenceposts with white labeled caps: these denote the corners of each Landsat plot.
Take a look at the Landsat plot map above and you’ll see each plot in yellow, overlaying an actual Landsat image (dated October 2015). Each plot is named by a special code, corresponding in part to its location:
- In many cases, the first four letters of the plot name represent its general location; e.g., FRRG represents Front Ridge. Then, the remaining two letters represent the aspect of the plot (which way it faces); e.g., SE means that the plot is a sunny slope facing southeast.
- In some cases, all six letters represent the plot location; e.g., FLDRIP stands for field/riparian area, FRNDRW stands for Fern Draw, and NWSLOP stands for Northwest Slope.
Our ACCF Landsat plots include vegetation on the site’s sunnier, southeast facing slopes, as well as its wetter, northwest-facing slopes, plus plots representing other variation on the ACCF site. Students can compare these plots in terms of vegetation, microclimate, soils, wildlife, and other properties.
Ultimately, students learn via these Landsat plots to appreciate the power of spatial scale. Landsat pixels are one visual way to connect zoomed in scales such as the ACCF site with zoomed out scales such as the entire Earth, and to remind students that processes at local and global scales are connected.
*By “nominal” we mean that these are the stated dimensions, and would be so on Earth’s equator, but just as lines of longitude converge as one moves poleward, the east-to-west dimension shrinks; thus, Landsat pixels on the ACCF site (approximately 43 degrees N latitude) are 30 meters tall but less than 30 meters wide. Each Landsat plot, then, actually measures 90 meters north/south by approximately 65.9 meters east/west.